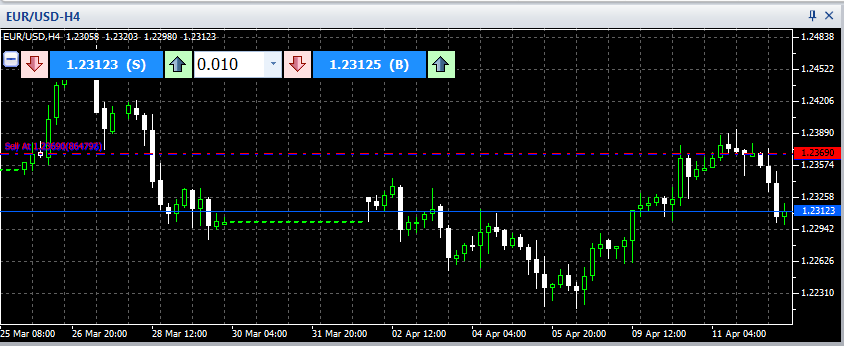
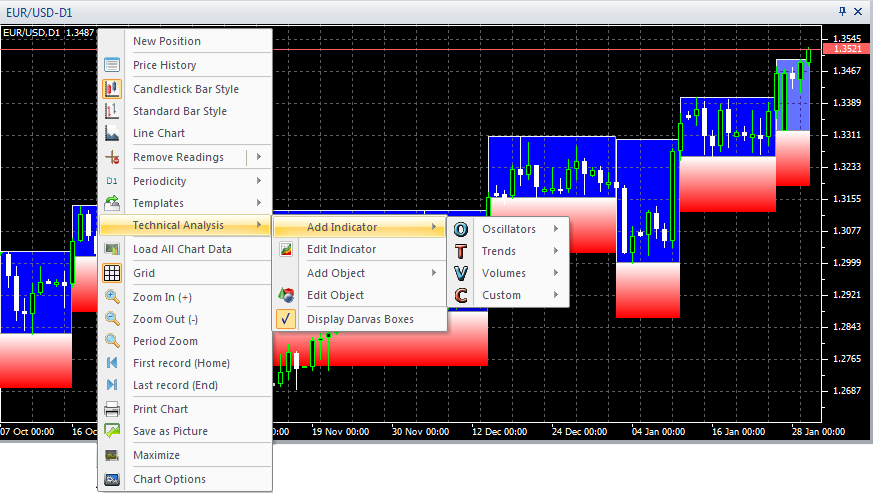
Charting on the VertexFX Trader is an undividable part of the system, on the VertexFX Trader, charts are presented in a deferent way rather than the other systems, the style of the charts on the VertexFX trader can be felt that it is deferent and smoother on interactivity and movement.
Every chart has to have the basic features, the periodicity, the candles interactivity, and some other features that must become in the chart to be somehow useful.
With a creative features, like interactive candle data line, smooth interactive scrolling and movement for the chart candles and periods, multiple chart opening ability, and multiple periods for the same symbol ability, the VTL for strategies and automatic trading availability, and other more chart abilities and settings; charts on VertexFX Trader are distinguished from any other chart just by eye inspection.
Server structure on the VertexFX Trader supports the abilities of the charting in many places, from the databases that are highly normalized to allow the ease of data retirement and insertion candles data and an ability to save history up to more than 20 year, the history server that is an individual application allowing the high performance for collecting the prices and generating the candle data, to the feed structure and the abilities to filter the prices and preventing wrong quotes to appear on the charts.
Press F11 at your VertexFX Trader to make the chart as full screen at, to allow you to have the great area for your technical analyses and indicators and inspect the features of the VertexFX Traders chart, like the notes on the charts, the drawings, the ability to trade on the chart.
Any drawing you add, any vertical line, or horizontal line can be declared using a note, and they are all editable, the notes, the drawing option, the drawing place.
Related Topics:

