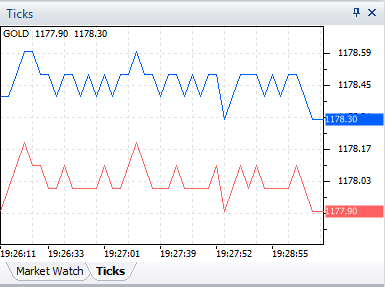
The tick window shows the moving bid price of the selected symbol from the market watch in the red line, you can also show the moving ask price which will appear in blue color. For example, the following image is a tick chart window for the Gold symbol:

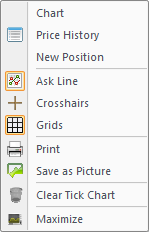
There are some options for the ticks window to appear when you press right-click on it.

| Option | Description |
| Chart | To draw the selected symbol chart on the chart window |
| Price History | Opens a new window containing a list of historical prices for the selected symbol in the ticks window |
| New Position | Opens the one-click trade screen to place an order on the symbol which is selected in the tick chart window |
| Ask Line | To show/ hide the ask line from the tick chart window |
| Crosshairs | To show the cursor as a crosshair to the tick chart window |
| Grids | To show/ hide the grids from the tick chart window |
| To print the tick chart window if your computer is connected to a printer | |
| Save as Picture | To save the tick chart window as a picture as JPG |
| Clear Tick Chart | To empty the tick chart window |
| Maximize | To maximize the tick chart window |
See Also