It is very important before subscribing to any VertexFX signal provider, to view his profile and considering the percentage of successful operations and the diversification of the financial instruments traded by the expert providers.The view option shows any registered provider details, by pressing on view a new page will open and contains the following.
In the left side you will see the signal provider status area in which contains the following information for the selected provider:
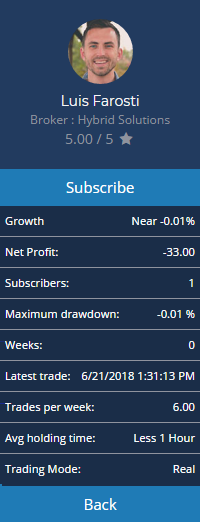
| Value | Description |
| Growth | Balance growth in percent as a result of trading operations |
| Net Profit | The difference between the gross profit and the gross loss |
| Subscribers | Number of active subscriptions to signal |
| Maximum drawdown | Maximal drawdown in percent for balance/equity |
| Weeks | Trading account lifetime in weeks starting from the first trade |
| Last trade | Time elapsed from the last trade on account |
| Trades per week | Average number of trades on signals account for 7 days |
| Avg holding time | Average time of holding an open position |
| Trading Mode | The user account type (Real/Demo) |
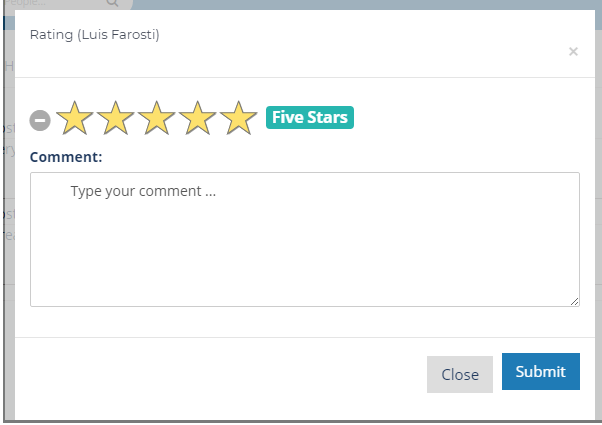
Under the provider name, there is an option to rate the provider which will show up in the provider review tab.
1- Account
Shows the provider balance and Growth curve which indicates the trend of his profit/loss per each trade.

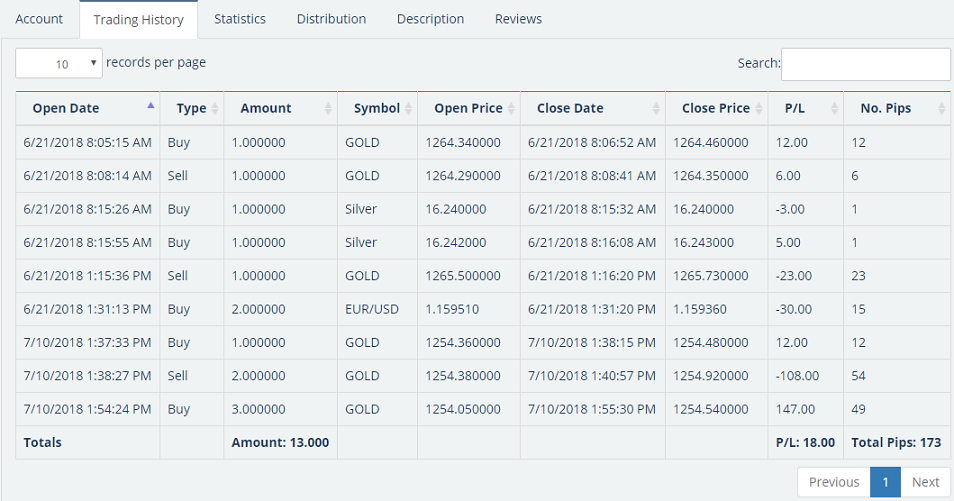
Shows details of each trade placed by the provider.
Shows statistic numbers for the whole trades placed by the provider.
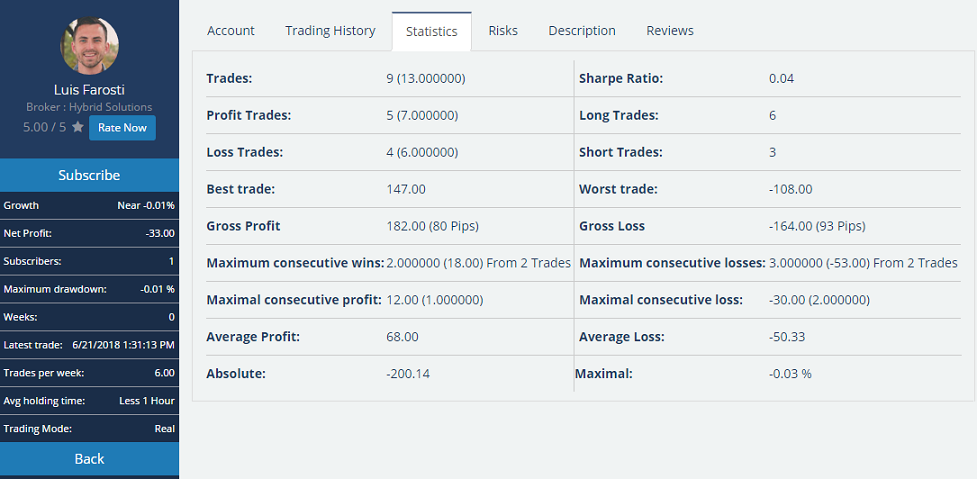
| Value | Description |
| Trades | Total number of trades (Total amount of trades) |
| Profit Trades | Number of profitable trades (Total amount of trades) |
| Loss Trades | Number of non-profitable trades (Total amount of trades) |
| Best Trade | Largest profiting trade |
| Gross Profit | Total profit/loss for all profitable trades (Total pips of trades) |
| Maximum Consecutive Wins | Total trades amount in longest profitable sequence (Total profit of this sequence) Number of trades |
| Maximal Consecutive Profit | Largest profit in a continuous profitable sequence (Amount of trades placed within this sequence) |
| Average Profit | Equals to the sum of (Each trade profitmultiplied by trade amount) divided by total profitable tradesamount |
| Absolute | The initial balance drawdown which indicates to what extent the balance has decreased, relevant to the initial value |
| Sharpe Ratio | Shows how AHPR (Average of Holding Period Returns) decreased by the RFR (risk-free rate) relates to SD (standard deviation) of the HPR (Holding Period Returns) sequence |
| Long Trades | Total number of buy trades of financial instruments |
| Short Trades | Total number of sell trades of financial instruments |
| Worst trade | Largest losing trade |
| Gross Loss | Total profit/loss for all non-profitable trades (Total trades pips) |
| Maximum consecutive losses | Total trades amount in longest losing sequence (Total loss of this sequence) Number of trades |
| Maximal consecutive loss | Largest loss in a continuous losing sequence (Amount of trades placed within this sequence) |
| Average Loss | Equals to the sum of (Each trades loss multiplied by trade amount) divided by total non-profitable tradesamount |
| Money Drawdown | Largest difference between the last maximum and minimum balance |
4- Distribution
Contains the following charts:
- Number of Deals (Symbol).
- Buy/Sell Count.
- Buy/Sell Amount.
- Total Profit/Loss.
- Sell Deals Profit/Loss.
- Buy Deals Profit/Loss.
- Total Pips.
- Sell Pips Details.
- Buy Pips Details.

A description set by the provider to know about his experience in the signal field.

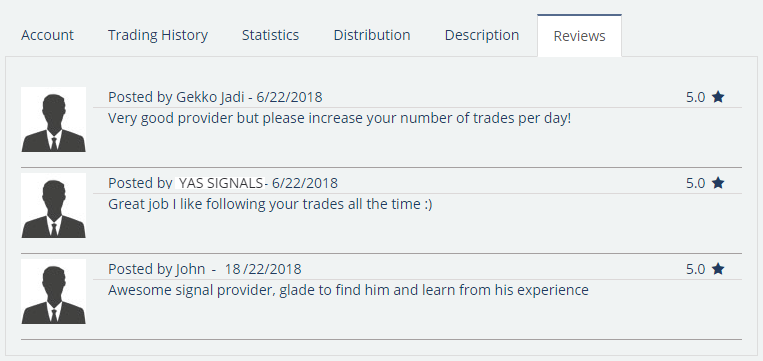
Shows the traders reviews about this provider.
See Also