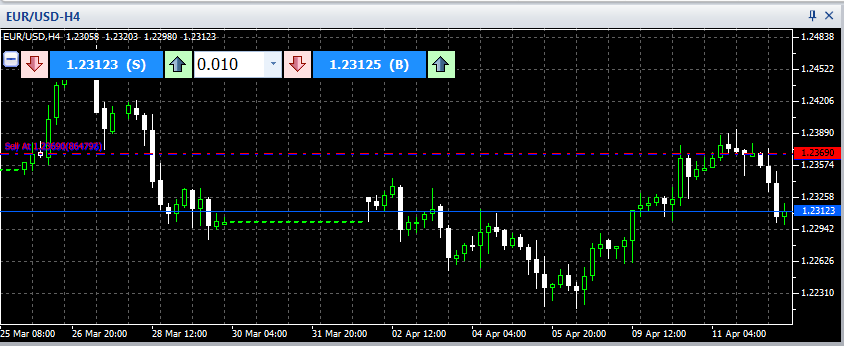
- In the Chart Window you will be able to see any chart that belongs to any symbol that exist in the Market Watch, just to drag and drop any desired symbol from the market watch to the chart window or right click on the desired symbol from the market watch and choose “Chart “, for example the following chart belongs to the one day Gold symbol:

- From the chart upper left corneryou may use the quick trading cells to place trade directly.
- You canupdate orders (Entry Orders or SL/TP Orders) directly from the chartby dragging the horizontal line to the desired price.
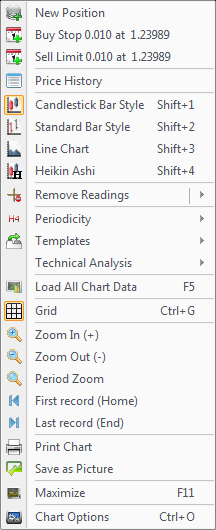
- If you press right click on the chart window you will be able to see some options as the following image:

- Each chart options descriptions are as in the following table:
| Option | Description |
| Opens the one click trade screen that belongs to the symbol chart to place a new position | |
| To open buy stop order at the current allowed price | |
| To open sell limitorder at the current allowed price | |
| It opens a window which contains list ofthe prices history for the selected symbol in chart window | |
| To view the chart candlesas sticks in chart window | |
| To view the chartcandlesas standard barin chart window | |
| To view the chartas line in chart window | |
| To view the chartasHeikin Ashi style | |
| Toremove all the crosshairs on the chart window, or remove the available crosshairs from the drop down option in the Remove Readings button | |
|
To change the chart periodicity to one of the following periods:
|
|
| Add/ remove some indicators, and also you can remove all the added templates from the blank option | |
| To add/ edit indicators to the chart window, and also to add/ edit object to the chart window | |
| To load all dataof the chartin chart window from beginningtill now | |
| To show/ hide grids on the chart window | |
| To maximize the zooming on the chart window | |
| To minimizethe zooming on the chart window | |
| After selecting this option define the desired period to be zoomed in by clicking in the starting of the period then another click on the end of the period in the chart window | |
| To drags the chart step forward by one click | |
| To drags the chart step backward by one click | |
| Use this option to print the picture of the chart if your computer if it connected to a printer | |
| Use this option to save the picture of the chart window on your computer as JPG | |
| To maximize the chart window, you will notice after choosing it that theTechnical Analysis Toolbarwill be showing on the top of the terminal | |
| Opens the chart options tab from theSystem Options, which allow youto edit the settings and colors of viewing the chart window |
See Also
 ,
, ,
, ,
, ,
, ,
,


