Binary Options Client Advanced Chart
In this section, we will discussthe VertexFX Client Binary Options chart in the home page, the technical chart tools and the options whichwill help you build your strategy.
Tools panel (left)
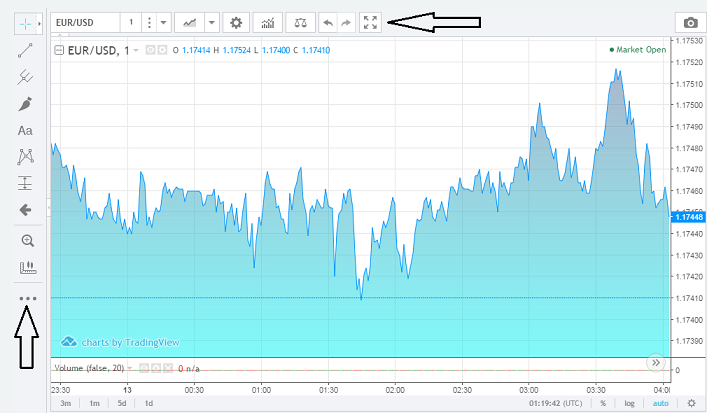
Contains tools for editing the chart and add drawings, each icon refers to a group of tools that can be expanded by clicking on the small arrow beside the icon.
|
|
Cursor, from here you can change the cursor type on the chart to be a Cross, Dot or an Arrow, also you may select Eraser to remove an object from the chart. |
|
|
Lines, from here you can select and add any line objects to the chart. |
|
|
Study object, from here you can select and add any Fibonacci or Channels objects to the chart |
|
|
Drawings, from here you can select and add any Drawing objects to the chart. |
|
|
Texts, from here you can select and add any text objects to the chart. |
|
|
Patterns, from here you can select and add any Pattern objects to the chart. |
|
|
Positions, from here you can select and add any Position objects to the chart. |
|
|
Icons, from here you can select and add any Position objects to the chart. |
|
|
Zoom in, to zoom in a highlighted area on the chart |
|
|
Zoom out, to minimize the zooming from the highlighted area on the chart window |
|
|
Measure, in order to measure a period on the chart, you can also use the hot key (Shift+ Right Click) to measure |
|
|
Hidden tools, from here you can select Magnet Mode, Stay in Drawing mode, Lock all Drawing tools, Hide all Drawing tools, Show Objects tree or Remove All drawings |
Chart Options (on the top)
For managing the chart such as view, Symbol and period. Also for adding technical indicators.
|
|
Symbol list, in order to select the symbols or type it manually in order to show search results after clicking. |
|
|
Chart Period, to change the chart periodicity to one of the following periods: |
|
|
Bars Style, from here you can change the price styles on the chart to view it as Bars, Candles, Hollow Candles, Heikin Ashi, Line or Area. |
|
|
Chart Properties, from here you can customize the Style, Background and control the chart scale and change the time zone. We will discuss more regarding Chart Properties from Chart properties help index |
|
|
Indicators, from here you can add the desired technical indicator to the chart. |
|
|
Symbol Compare, From here you can add another symbol to the chart or compare between Symbols charts. |
|
|
Undo, to reverse your last action. *You can reverse more than one action. |
|
|
To reverse your last Undo. You can reverse more than one action that has been undone. Redo icon is enabled only after Undo action. |
|
|
Full screen, when clicking on this icon it will view the chart on full screen mode. |
|
|
Chart Image, Click on this button to take in instant snapshot of the current chart with all of the current symbol information. |
See Also