Binary Options Chart Properties![]()
When clicking on Chart Properties from chart window options a pop window will appear that contains the following chart customization options
- Style
- Scales
- Background
- Timezone/Sessions

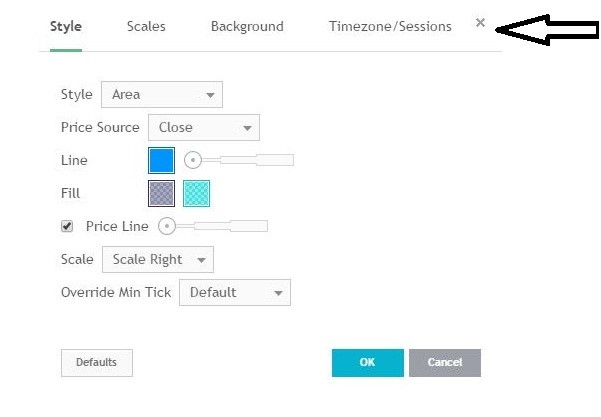
Style tab:
By default when you click on Chart Properties it will show the Style tab (as the image above), from here you can choose from several different styles (Bars, Candles, Hollow Candles, Heikin Ashi, Line or Area) to view the chart with, each style has a different set of settings.

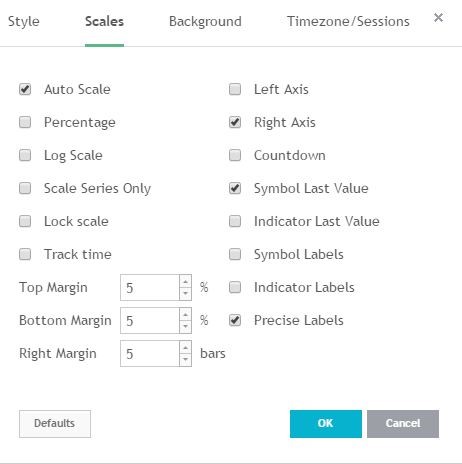
Scales tab:
In order to control the scales, margins of the chart and choose which Values and labels to view or hide overthe chart.

Background tab:
From hereyou can control the background of the chart
- Background Colors.
- lines thickness.
- Show/Hide (Symbols Description, OHLC values, Indicator Titles, Indicator Arguments, Indicator Values)
- Visibility o Navigation Buttons.

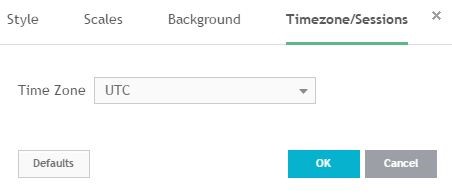
Timezone/Sessions tab
From here you can control the Timezone shown on the chart.Once you finish customizing the chart and finish selecting the settings to view the chart:
- Click on
 button to save and apply the changes on the chart.
 - Click on
 buttonto discard the changes.
 - Click on
 buttonto restore the default settings of the chart.
See Also