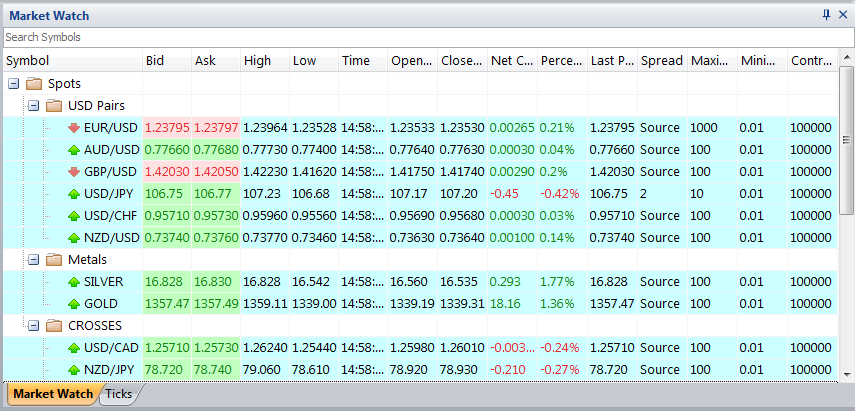
- This is how the market watch looks like in VertexFX platform, it contains many columns explained below:
| Column Name | Description |
| Search Symbol | Search field for the existing symbols onthe market watch window |
| Symbol | Contains the symbols name that you are able to trade on |
| Bid | The current market bid price for each symbol |
| Ask | The current market ask price for each symbol |
| High | The current market day high price for each symbol |
| Low | The current market day lowprice for each symbol |
| Time | The time of the last update for the symbol price |
| Expiry Date | The expiry date for each symbol is set from the dealing room side, this option often appears for the future symbols, which shows when will be the last time that you cantradeon each symbol |
| Open Price | The first market open price for each symbol in the current day |
| Close Price | The last market close price for each symbol in the previous day |
| Net Change | Equals to the Bid Price Close Price |
| Percent Change | Equals to = (Net Change / Close Price) * 100% |
| Last Price | Shows the last price was traded for each symbol and this price is provided from the feed provider application |
| Spread | Shows thespread amount for each symbol which is the difference between the bid/ask price |
| Maximum Amount | Shows themaximum allowed amount per deal for each symbol |
| Minimum Amount | Shows theminimum allowed amount per deal for each symbol |
| Commission | Shows thecalculated commission for each symbol per 1 lot |
| Contract Size | Shows thecontract size for each symbol |
- The market watch have many options which appears when you press right click on any desired symbol, they are as the following image:

1- Trade Symbol
- Choosing this option will open theone click tradescreen, for example the following image belongs to the Gold Symbol:

- Many options can be done in the one click trade screen, in which:
| Option | Description |
| Cancel All Order | This button will cancel all your Limit/ Stop orders on this symbol |
| Amount | In this area you can set the desired amount to trade on and you will see the minimum/maximum amount per deal |
| Total | How much the total net hedge amount on the selected symbol |
| Sell At (New Position tab) | To place a sell position with the current price of this symbol |
| Buy At(New Position tab) | To place a buy position with the current price of this symbol |
| Your Comment … | To add a comment to the Orders/Positions |
| One Click Limit/Stop order Placing | In this area you can place a Limit/ Stop order by one click on the (Sell Limit, Sell Stop, Buy Stop or Buy Limit) and a Limit/ Stop order will be placed on this symbol with the price that is beside the place where you set the Limit/ Stop order |
| Tick Chart | In the bottom of the one click trading screen you will see the tick chart of this symbol, you can show/ hide this window by clicking on the green arrows ^^^ |
| Close Position tab | If you have open positions on the selected symbol you will be able to select the ticket ID and close it at market price, and also you can set a take profit or stop loss order on the selected ticket ID
|
| Close by Hedge tab | If you have opened Buy and Sell positions you will be able to select the ticket IDs of the buy and sell to close them by hedge And also you can close all your open Buy and sell positions buy hedge  |
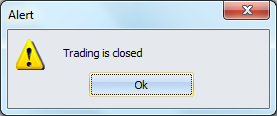
- If you are trying to place an order and you get the following message (Trading is closed), this message means that the market is closed and you will not be able to trade on the selected symbol till the market opens.
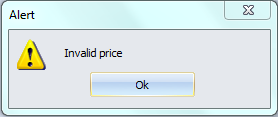
- When you place a Limit/ Stop order an alerting message appear (Invalid Price). This message appears when you set a Limit/ Stop order with offset close to the current market price, so you will need to increase your order offset to place your Limit/ Stop order.
- The following message (Unable to get a quote on this symbol due to market conditions) will appear if the rates of the selected symbol stopped for certain seconds, so you will not be able to trade on the selected symbol till its rates start to move again.

- While you are using VertexFX system, you should makesure that your Internet connection is at a good speed to avoid seeing the message (Unable to get a quote due to bad connection, please try again).

-
- If you placed a limit/ stop order, it will be in the pending order till its price hit, and when this order hits, it will be showing in red bold color in the trade panel, but if after the hit you tried to delete this order, a message as the following will appearsince the order is hit.

-
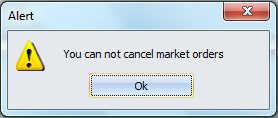
- If you tried to close a market order, itwill be in the pending mode, and if youtried to cancel this market order from the pending orders, the message (You can not cancel market orders) will appear to you. So you will need to wait till the dealing room takes an action tothis order.
-
- If you tried to close a market order, it will be in the pending mode, and if you tried to close this market order again from the trade window, the message (Position is in pending mode) will appear to you. So you will need to wait till the dealing room takes an action tothis order.

- This message Not Enough Money may appear trading due to:
- If you want to open a new position on a certain symbol and your equity is less than the initial margin per lot of this symbol.
- If you tried to close one of the two hedge positions you got while your equity is less than the initial margin per lot of this symbol.

2-Delivery
- In case the selected symbol is physical, this option opens the Delivery Request Catalog.
3- New Entry Order
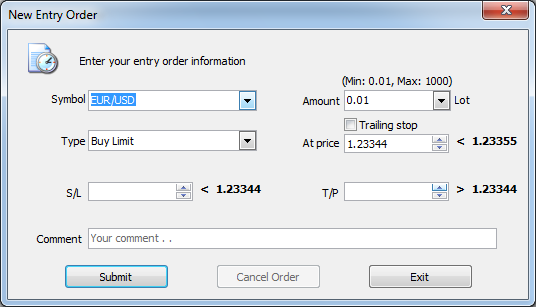
- When you choose this option, a window will open as the following image. You will be able to set a Limit/ Stop order with the inserted information (Symbol name, Amount, Order Type, At Which Price, enable the Trilling Stop, Stop loss or take Profit) and after you fill all the desired information press on the Submit button to place the order.
4- Chart![]()
- Use this option to draw the selected symbol to the chart window.
5-Hide
- To hide the selected symbol from the market watch.
6-Show/ Hide Symbol
- This option opens a window which contains the list of symbols as the following image, and you willbe able to show/ hide the desired symbol(s).

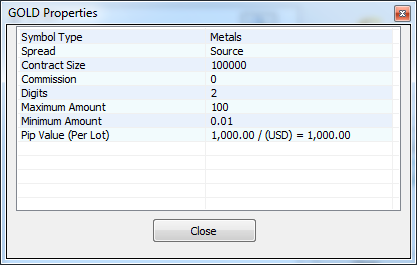
- If you press on the properties button, a small window will open with the properties of the select symbol, for example the following image is for the Gold Symbol.
7- High Light
- You can highlight the selected symbol in the market watch using this option.
8- Reset to Default
- To reset the selected symbol color to the default viewing settings.
9-Reset All to Default
- To reset the all symbol color to the default viewing settings.
10- Report
- The report option opens a snapshot for the market watch in HTML page or excel sheet.
11- Show Hide/ Low
- To show or hide the high and low columns.
12- Show Time
- To show or hide the Time column.
13- View Settings
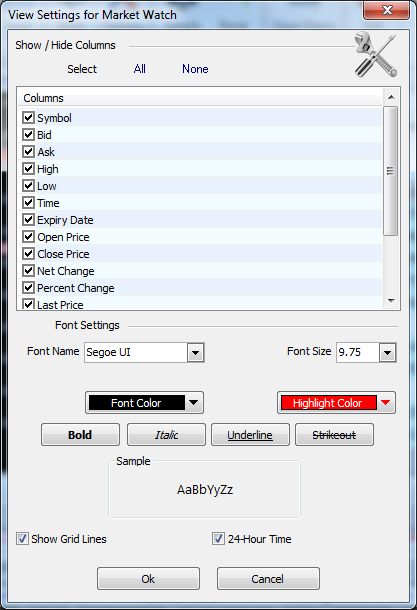
- The View Settings option opens a window as the following image, which allow you to change the settings of viewing the market watch.
14-Advanced Market Watch
- This option will enable/disable the advanced market watch in which the market watch will appear more organized under groups like a tree.
15- Export DDE to Microsoft Excel
- This option will export the DDE (Dynamic Data Exchange) for the symbols of the market watch to a Microsoft Excel sheet.
- If this option is disabled you can enable it from the General area of the System Options
 .
.
16- Maximize
This option to maximize the market watch.
See Also