This is the Charts Technical Analysis which contains nine sections:
1-Trade

- New Position to open the one click trading screen to place a New Position for the drawnsymbolChart Window.
- New Entry Order to place Limit/Stop order for the drawn symbol Chart Window.
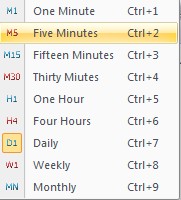
2- Chart Period

- From here you will be able to change the periodicity of the chart (1 minute, 5 minutes, 15 minutes, 30 minutes, 1 hour, 4 hours, 1 day, 1 week, and 1 month).
- For more info, checkChart Windowoptions.
3- Cursor

- From here you can change the cursor type on the chart to either cursor or crosshairs.
- By choosing the crosshairs option, Hold the left click and move the cursor to change the readings.
- To save the readings of the Crosshairs on the chart just press right-click on the desired point while holding the left click.
- Also, you can remove all the crosshairs on the chart window, or remove the available crosshairs from the drop-down option in the Remove Readings button.
- For more info, checkChart Windowoptions.
4- Add Object

- From here you can choose any object type (Fibonacci, Line Studies, Channels, Drawings, or Symbols and Text) to be added to the chart window.
- Also, you can edit or delete the added object(s) to the chart window.
- For more info, please check Chart Window options.
5- Add an Indicator

- From here you can choose any indicator type (Oscillators, Trends, Volumes, or Custom) to be added to the chart window.
- Also, you can edit or delete the added indicator(s) to the chart window.
- Read more aboutTechnical Indicators functionality.
- For more info please checkChart Window options.
6- Darvas Boxes

- From here you can display the chart window candles according to the Darvas Boxes technique.
7- Templates

- To save or remove the added chart template(s).
8- Full Screen

- To maximize/minimize the chart window.
9- Strategy

- Choosing this option will open the VTL Editor (VertexFX Trading Language Editor).
- Read more about the VTL Client Scripts.
- Read more about the VTL Server Scripts.
See Also